Overview
Query Analytics for Elasticsearch and Opensearch
The Query Analytics engine allows identifying slowdowns or high system loads due to specific queries over time. Furthermore, it serves as a valuable tool for monitoring the historical performance of queries.
Tools such as slowlog allow us identifying queries slower than a certain threshold. That kind of slowness however can happen due to a search queue saturation which has little to do with the specific query itself, which means this could create false-positives - queries that aren't inherently problematic, or miss queries that are. Query analytics examines the larger picture - all of the queries over time, and additionally groups and visualizes the information to allow making sense of it.
To use Query Analytics, you'll need to install a lightweight query proxy between your cluster and the querying application. Queries will be forwarded to the search cluster and responses returned to the application as usual, however additionally the query and statistics from the response (such as latency) will be forwarded to Pulse.
When those queries reach the Pulse ingestion endpoint, we "clean up" the data, removing identifable information from all the values of queries and filters. The two leading characters of the values are left so that their sources can only be identified by the customer.
Similar queries with different search values are grouped together and assigned to sets of properties called "query fingerprints". This allows spotlighting the groups that consume the largest amount of resources. We also try to detect some known causes for slowness such as regex search, large aggregations, etc.
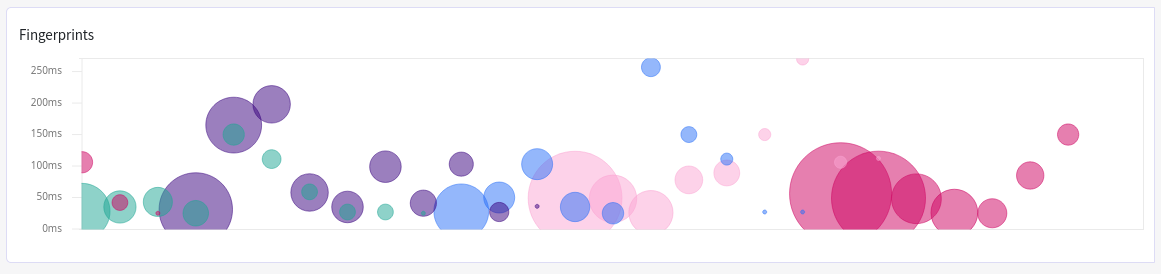
Here you can see "fingerprints" from a sample cluster. Bubble size corresponds to the number of queries within a group, while the position on Y-axis represents average latency. So, even though slowest queries are from the blue and the pink bubbles, we probably should pay more attention to the purple bubbles: they have significantly more queries.
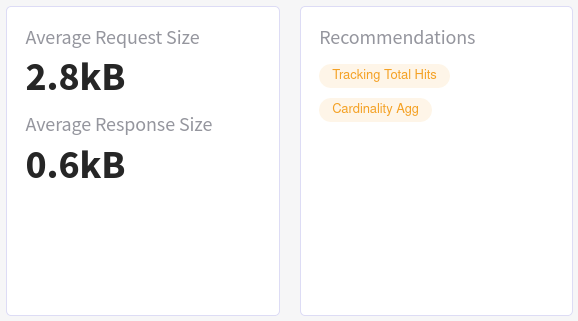
If we click into one of the bubbles we can drill down into a specific group, clearly seeing that the data size is not an issue here,
but rather might be the track_total_hits setting and the use of a cardinality aggregation which the group is tagged with:
It's also possible to see the queries themselves, where we can see that aggregating over the whole index probably wasn't a good idea:
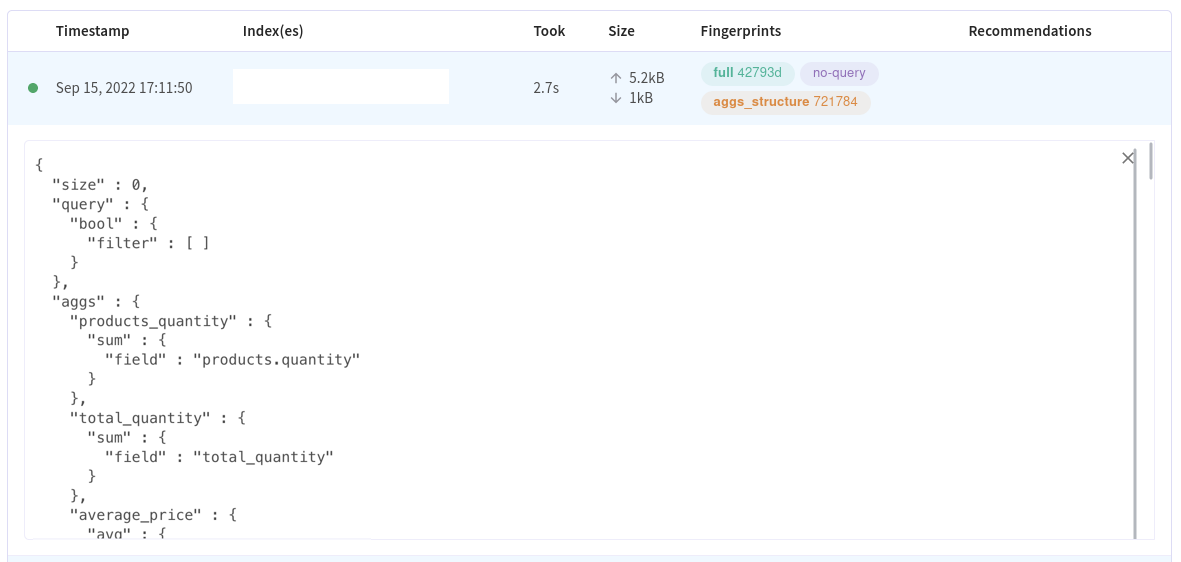
Clicking on a specific fingerprint will filter the results by that fingerprint.
We can take the query, fill in relevant values and run it against the real cluster for further tests. If we can notice effects that are present across many queries we can also consider reconfiguring things like caching and sharding/sample resolution.